Collecting host logs and metrics with the Elastic Distribution of the OpenTelemetry Collector into Elastic Cloud
Hey there! Given that Elastic has recently announced their own distribution of the OpenTelemetry Collector, I thought it would be good to download it and play with it a bit.
In this blog post, I’ll use the Elastic Distribution of OpenTelemetry Collector to send some logs and metrics to Elastic Cloud.
The Elastic blog post announcing 8.15 points to the Elastic Observability highlights blog post, which has a section named “Introducing the Elastic Distro for OpenTelemetry Collector”:
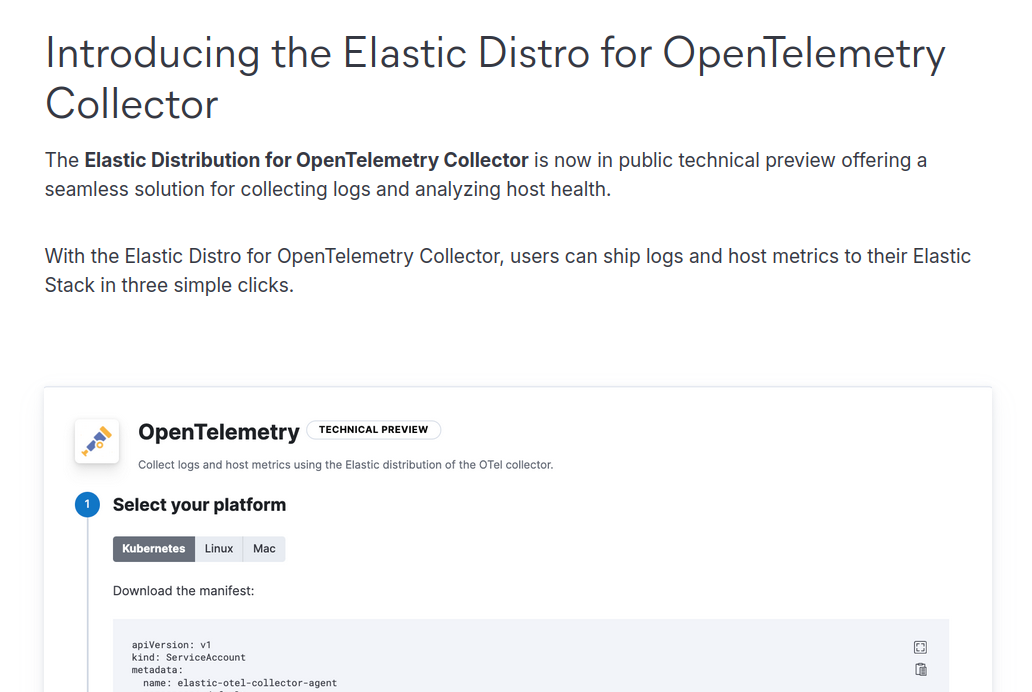
This section mentions an “OpenTelemetry” integration that guides the user through downloading and configuring the distro. Let’s run a deployment of Elasticsearch 8.15 in the Elastic Cloud (it has a free trial) and see what it looks like.
To create a deployment of Elasticsearch 8.15 for free (for a limited time), go to https://cloud.elastic.co.
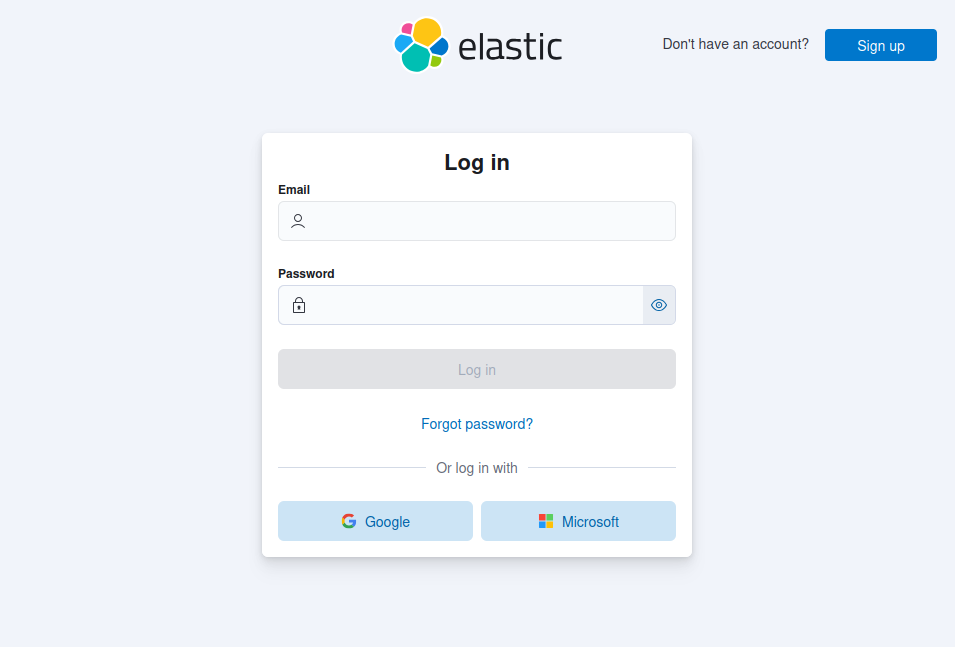
Click on “Sign up” in the top right corner.

Register using your preferred method (regular email or a Google or Microsoft account), confirm your new account and log in. Fill in some basic information and wait for the deployment to be created. After a maximum of a couple minutes, you should be presented with a screen like the one below.
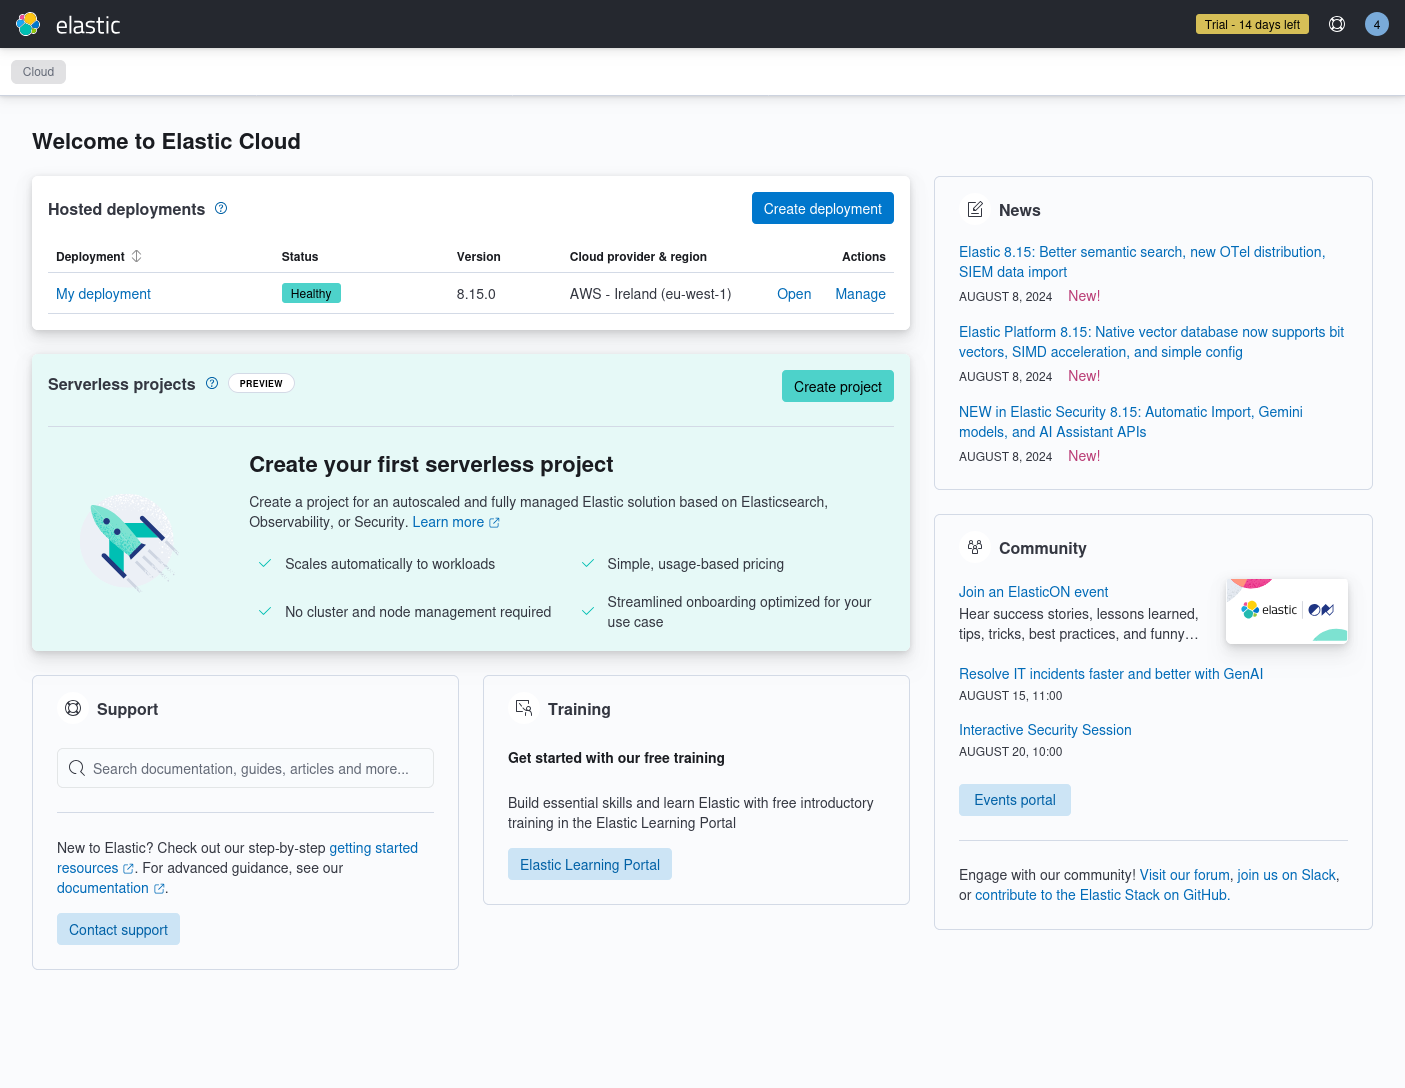
Look at the “Hosted deployments” list at the top. Make sure the version of the deployment you created is at least 8.15.0 and click on “Open” in the “My deployment” deployment. You should see a screen like the one below. Note: to get back to this screen later, click on the “Setup guides” button in the top right corner.
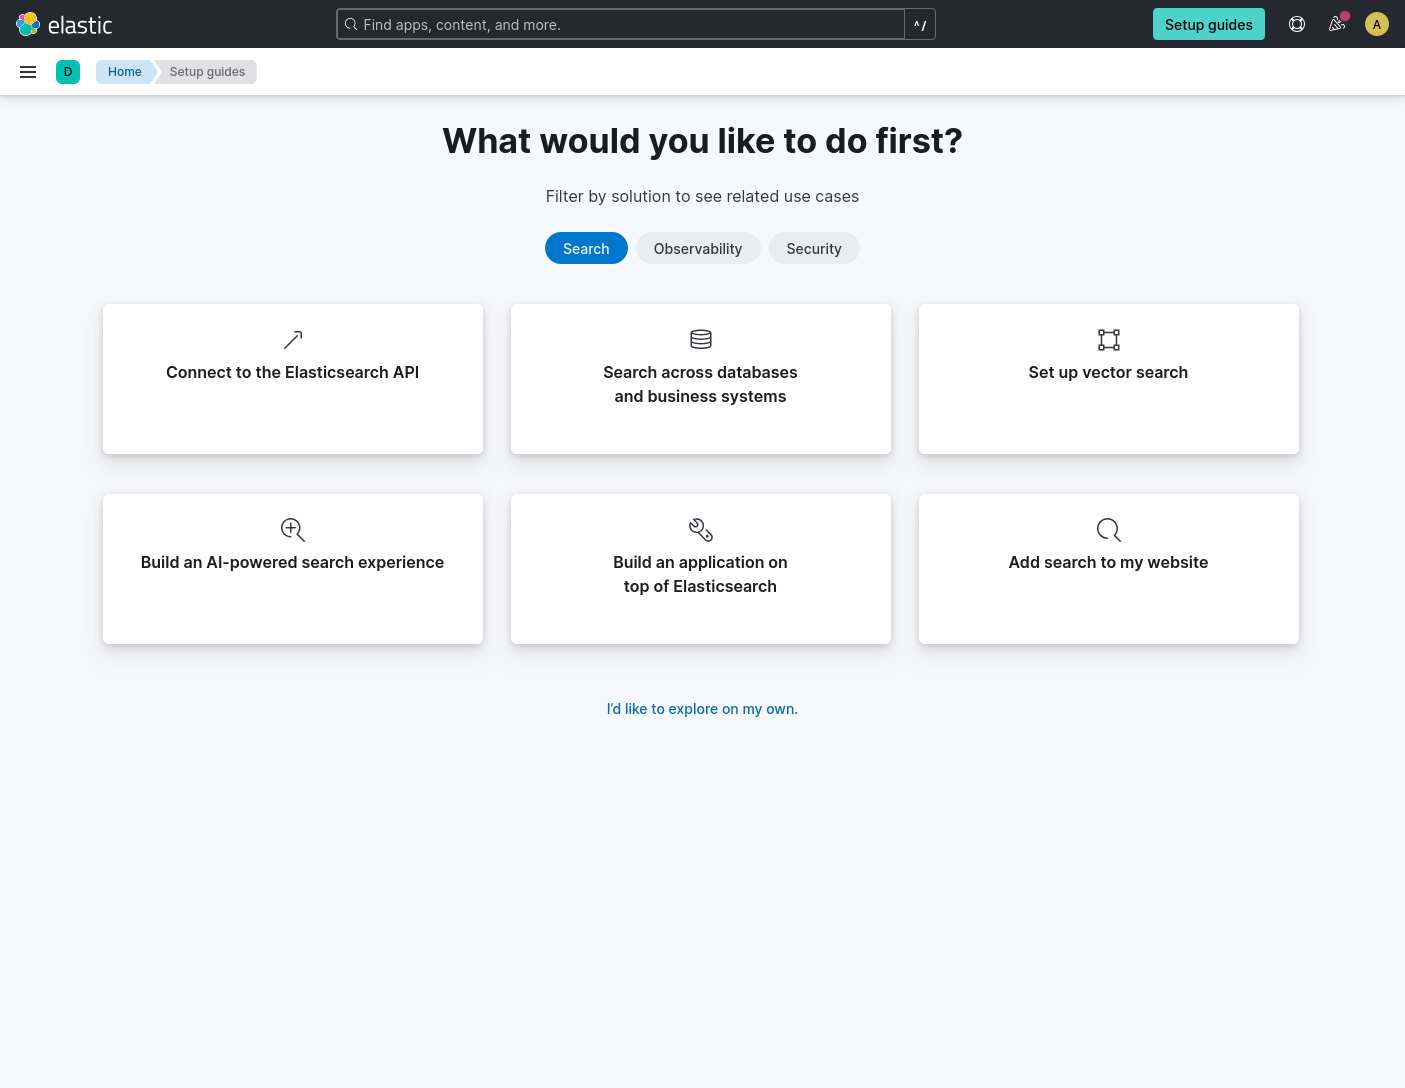
Click on the “Observability” solution to see what options are available there.
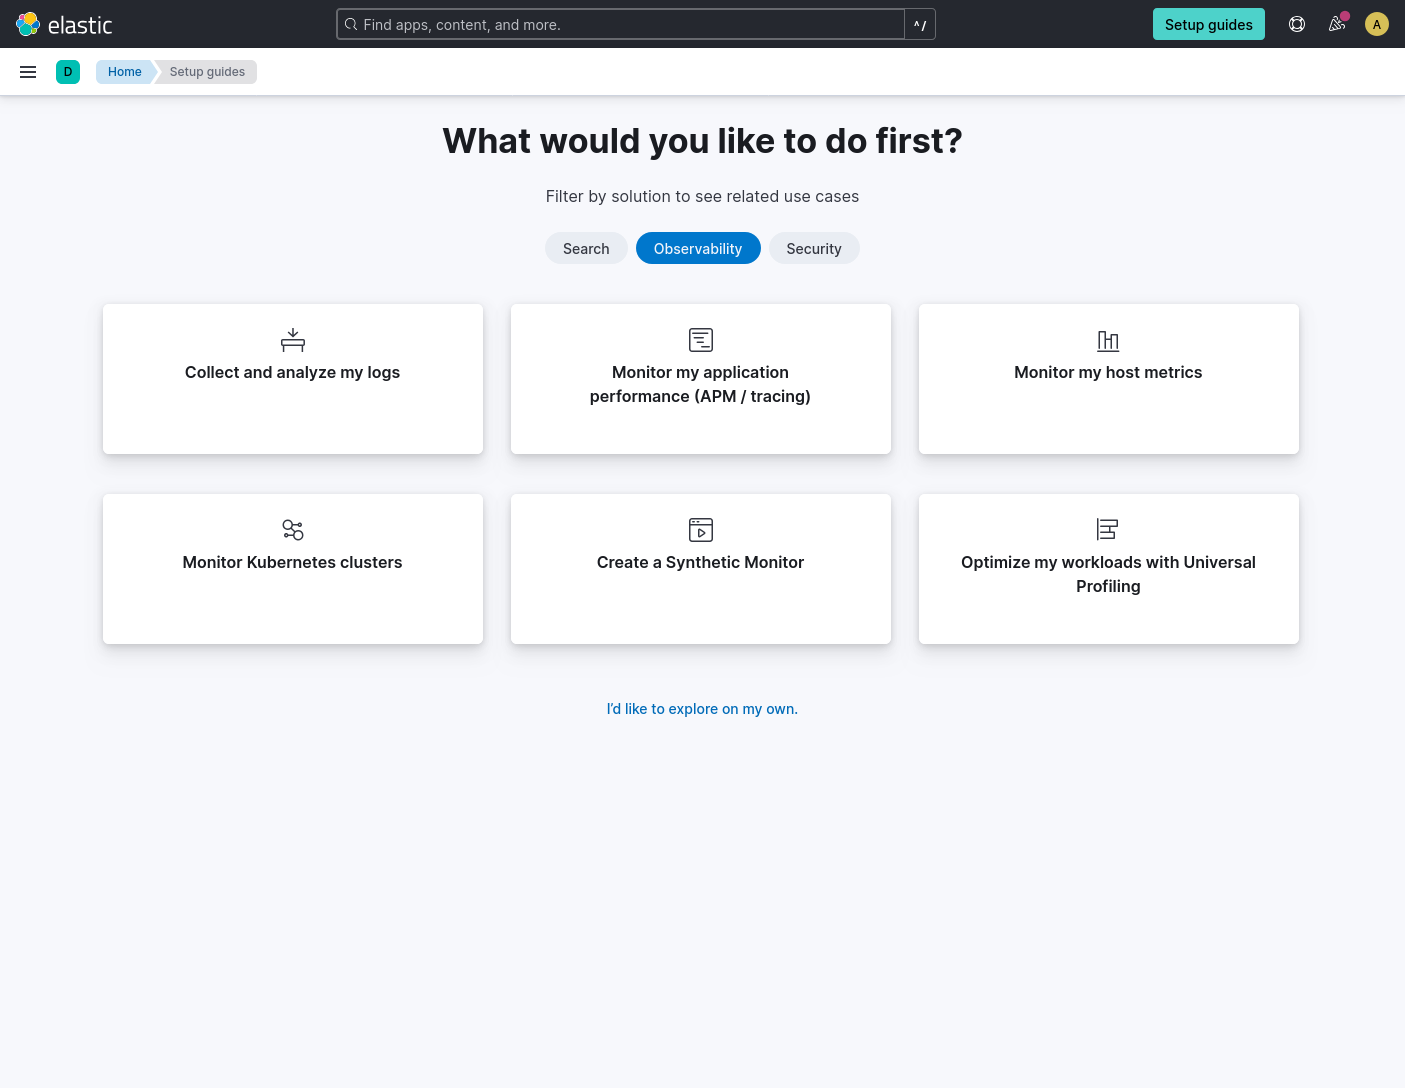
All of the options are interesting. Let’s try the “Monitor my host metrics”.
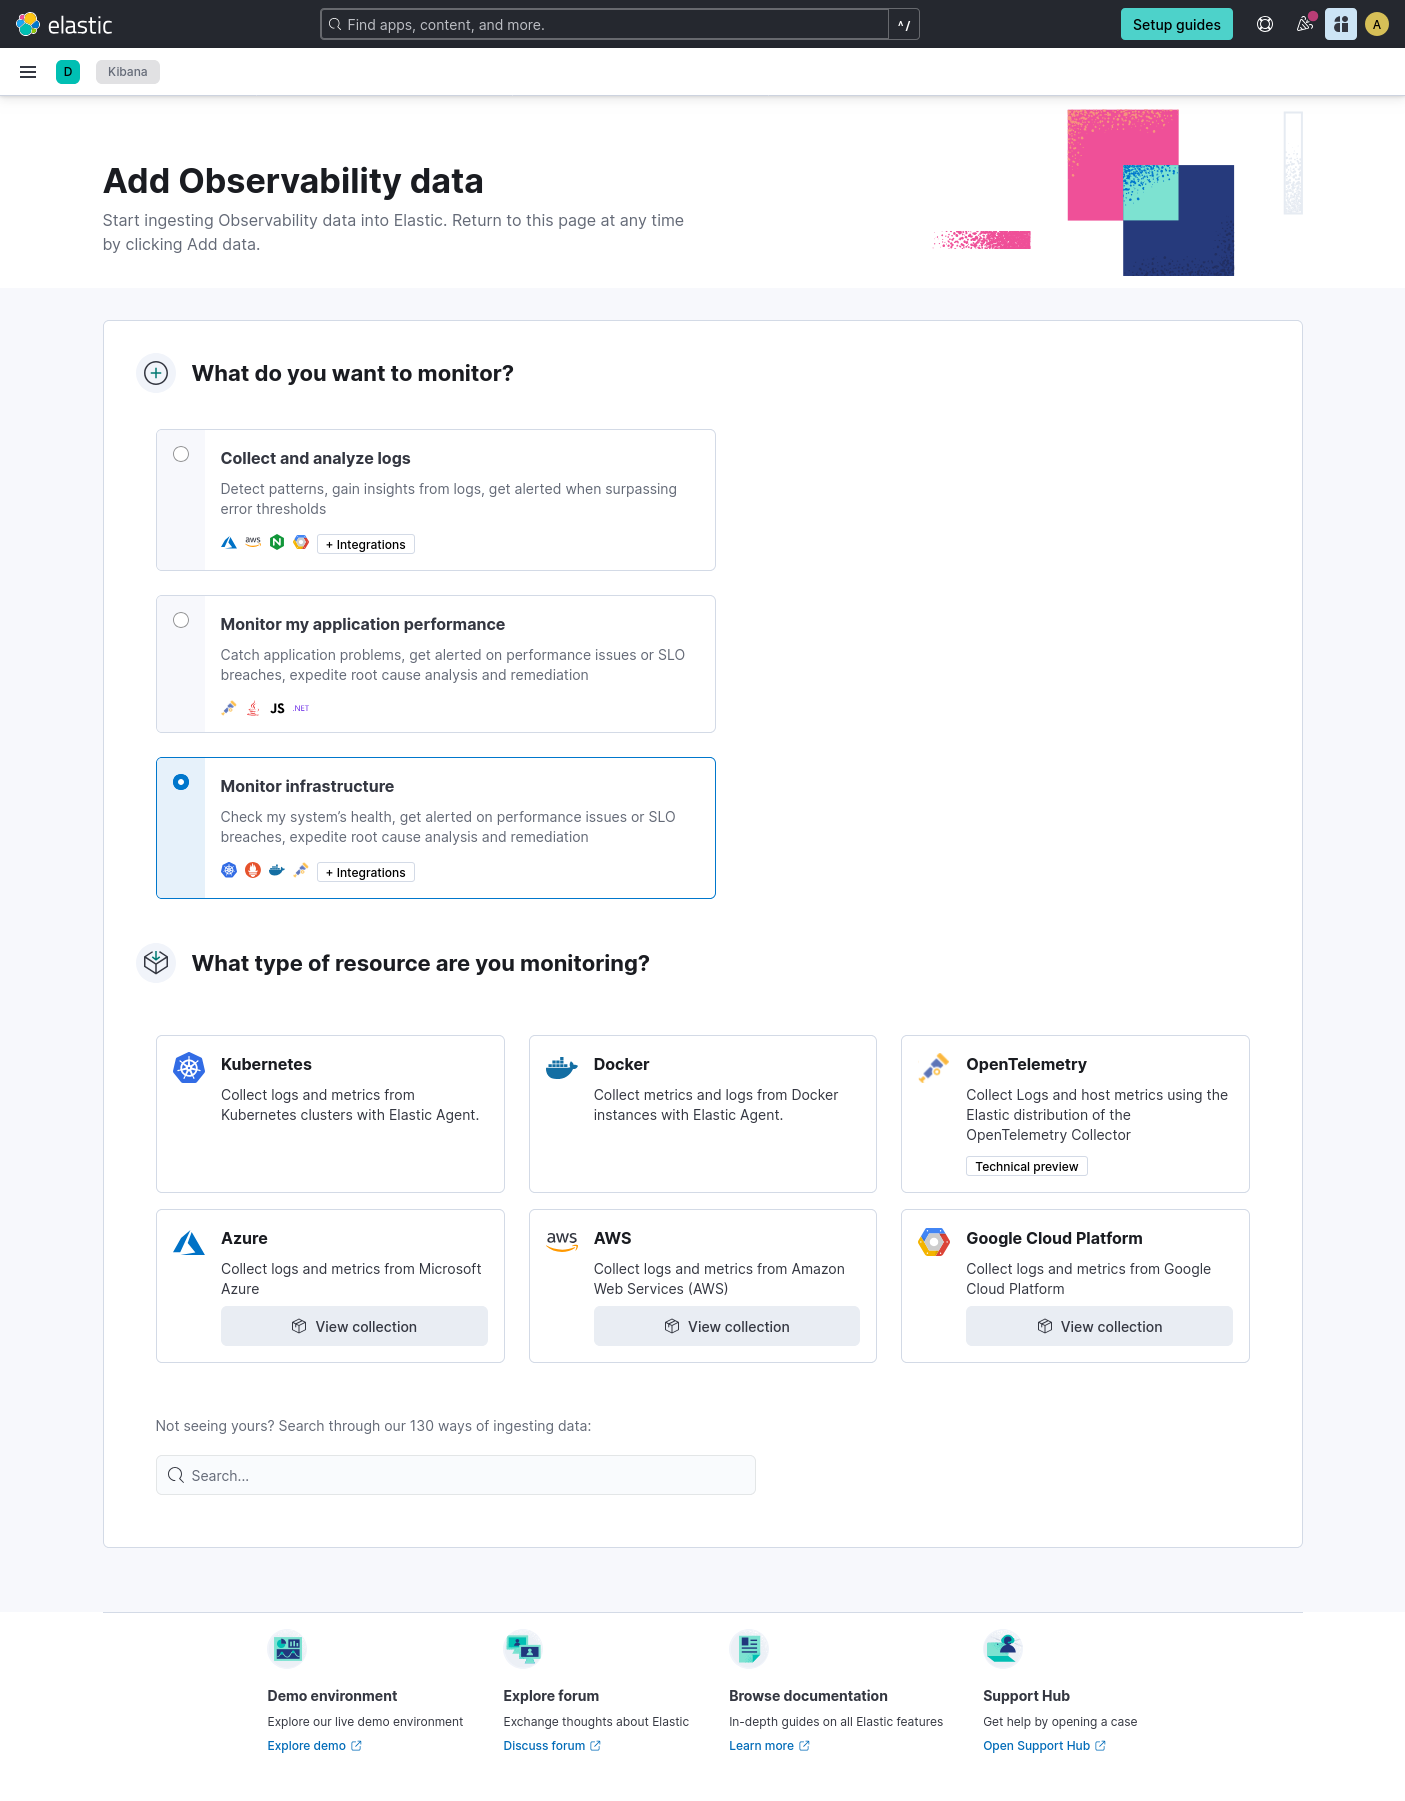
This is where it gets interesting! In the “What type of resource are you monitoring?” section, you can see the new “OpenTelemetry” tile, marked with “Technical preview”. The description says “Collect logs and host metrics using the Elastic distribution of the OpenTelemetry Collector”. That’s what we want! Let’s click on that.
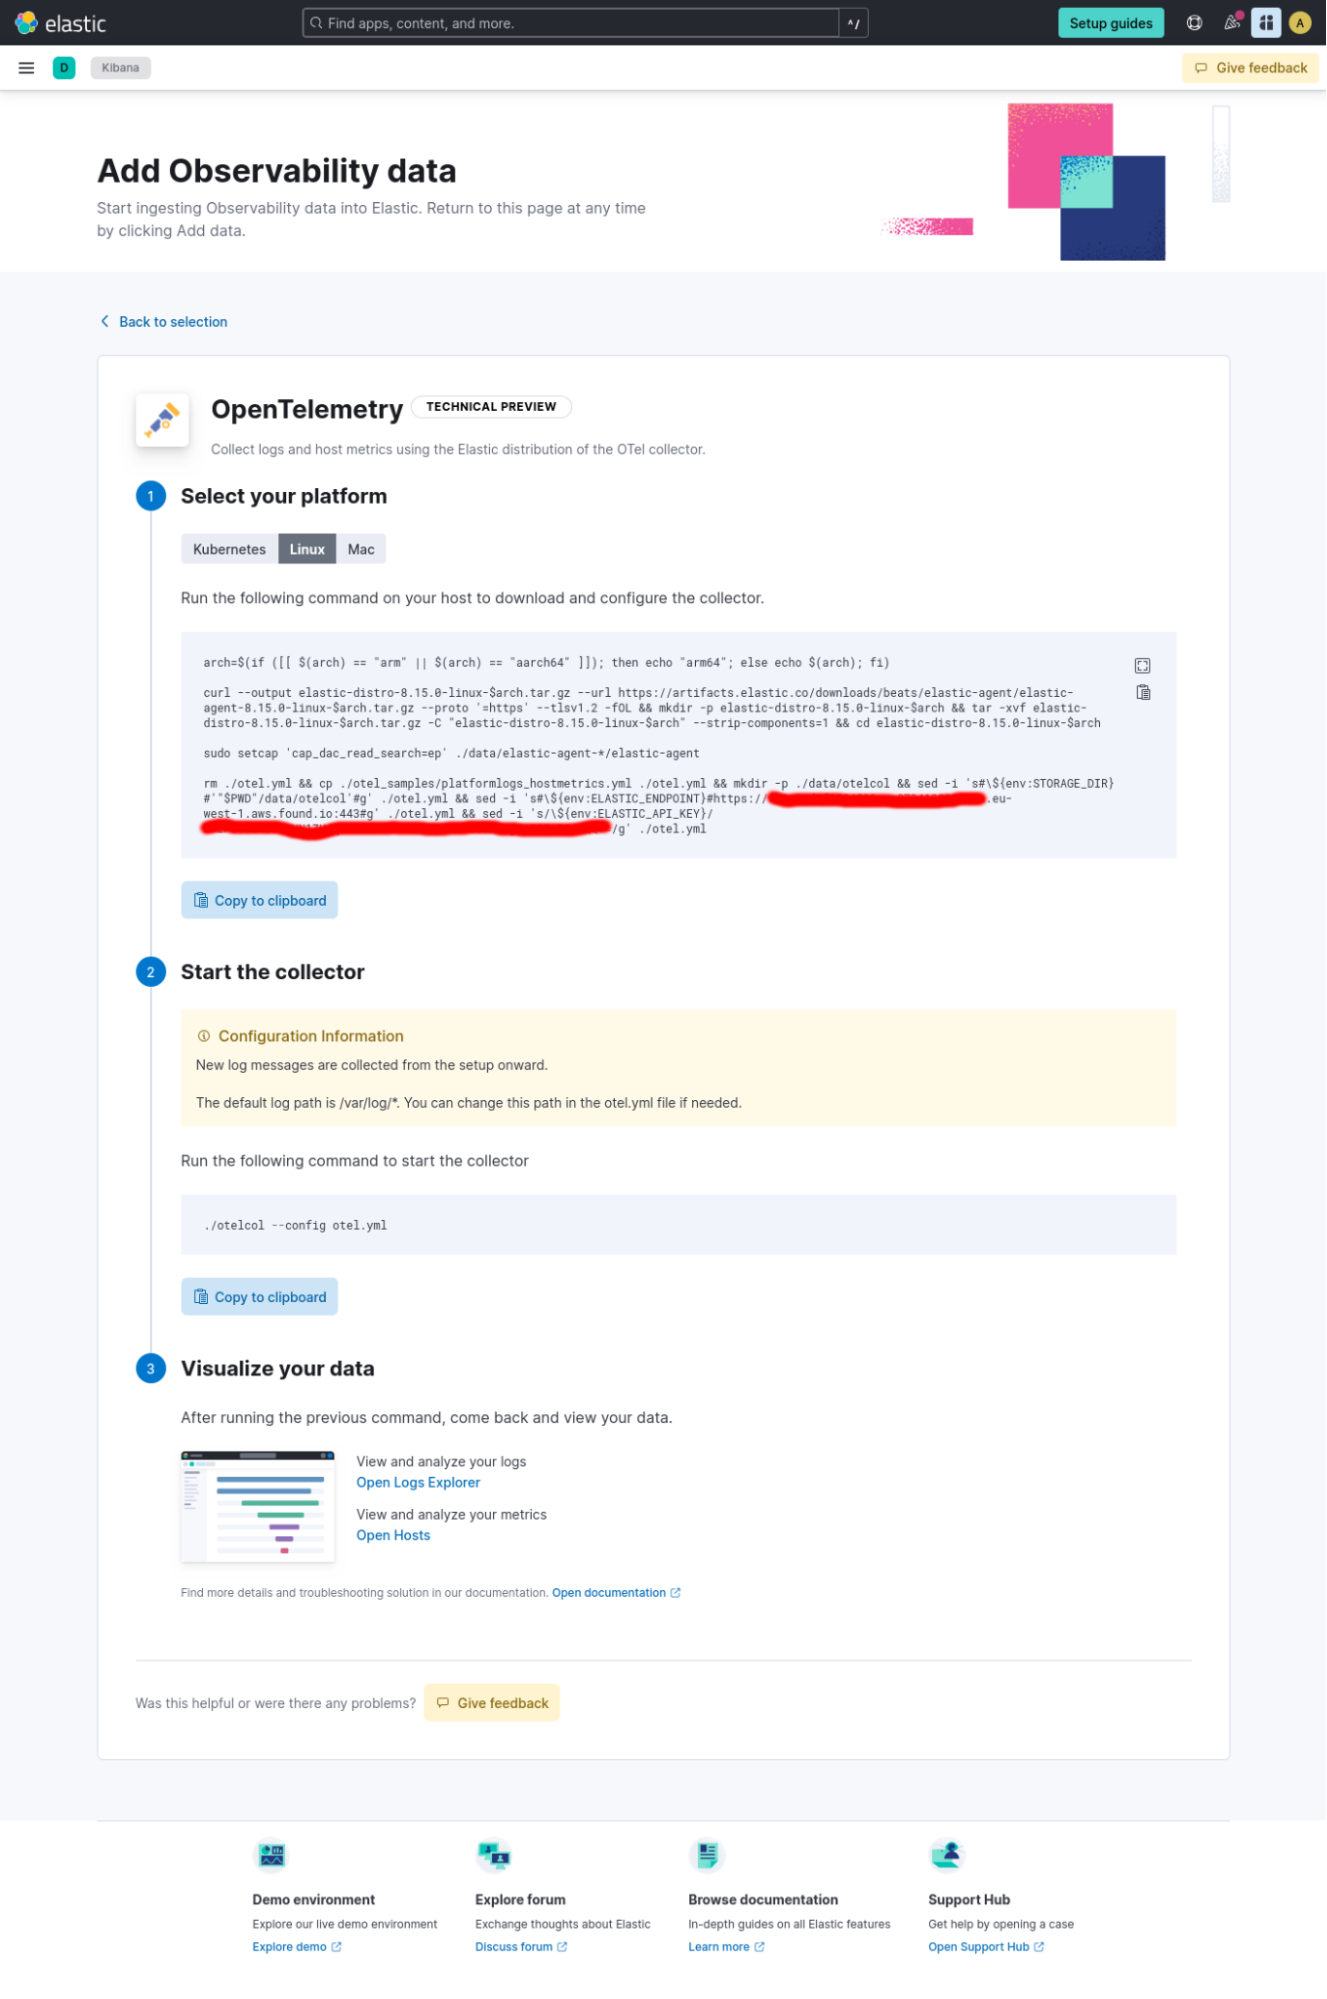
You can choose between instructions for Kubernetes, Linux and Mac. Note that Windows is not officially supported at this stage.
I’m on a Linux machine and this is the machine I want to monitor, so I’ll use the instructions for Linux. Let’s read the instructions to understand what is going to happen.
arch=$(if ([[ $(arch) == "arm" || $(arch) == "aarch64" ]]); then echo "arm64"; else echo $(arch); fi)
The first line uses the arch command to determine the architecture of the target host. You can see that both Intel and ARM architectures are supported for both Linux and MacOS.
curl --output elastic-distro-8.15.0-linux-$arch.tar.gz --url https://artifacts.elastic.co/downloads/beats/elastic-agent/elastic-agent-8.15.0-linux-$arch.tar.gz --proto '=https' --tlsv1.2 -fOL && mkdir -p elastic-distro-8.15.0-linux-$arch && tar -xvf elastic-distro-8.15.0-linux-$arch.tar.gz -C "elastic-distro-8.15.0-linux-$arch" --strip-components=1 && cd elastic-distro-8.15.0-linux-$arch
The next line uses curl command to download the Elastic Agent 8.15 tarball for the target platform, then uses tar to unpack the tarball into an elastic-distro-* directory and enters that directory. The Elastic Agent binary has the Elastic distro of OTel Collector embedded in it as a separate mode of operation, which we will see in a second.
sudo setcap 'cap_dac_read_search=ep' ./data/elastic-agent-*/elastic-agent
The Linux instructions include an additional line that sets the CAP_DAC_READ_SEARCH Linux capability on the Elastic Agent binary. This capability allows the collector to read any file on the host’s filesystem without needing to be run as root. This is needed to read e.g. some files from /proc directory on Linux, which are used to calculate host metrics by the OpenTelemetry Collector’s Host Metrics receiver.
rm ./otel.yml && cp ./otel_samples/platformlogs_hostmetrics.yml ./otel.yml && mkdir -p ./data/otelcol && sed -i '' 's#\${env:STORAGE_DIR}#'"$PWD"/data/otelcol'#g' ./otel.yml && sed -i '' 's#\${env:ELASTIC_ENDPOINT}#https://REDACTED.eu-west-1.aws.found.io:443#g' ./otel.yml && sed -i '' 's/\${env:ELASTIC_API_KEY}/REDACTED/g' ./otel.yml
The last line prepares the configuration for the collector by copying a specific template configuration file platformlogs_hostmetrics.yml from the samples directory and modifying the template to set the storage directory and the Elastic Cloud endpoint where the data should be sent. The resulting configuration will be placed in a file named otel.yml.
Let’s run these commands on the target machine that we want to monitor.
$ arch=$(if ([[ $(arch) == "arm" || $(arch) == "aarch64" ]]); then echo "arm64"; else echo $(arch); fi)
curl --output elastic-distro-8.15.0-linux-$arch.tar.gz --url https://artifacts.elastic.co/downloads/beats/elastic-agent/elastic-agent-8.15.0-linux-$arch.tar.gz --proto '=https' --tlsv1.2 -fOL && mkdir -p elastic-distro-8.15.0-linux-$arch && tar -xvf elastic-distro-8.15.0-linux-$arch.tar.gz -C "elastic-distro-8.15.0-linux-$arch" --strip-components=1 && cd elastic-distro-8.15.0-linux-$arch
sudo setcap 'cap_dac_read_search=ep' ./data/elastic-agent-*/elastic-agent

rm ./otel.yml && cp ./otel_samples/platformlogs_hostmetrics.yml ./otel.yml && mkdir -p ./data/otelcol && sed -i 's#\${env:STORAGE_DIR}#'"$PWD"/data/otelcol'#g' ./otel.yml && sed -i 's#\${env:ELASTIC_ENDPOINT}#https://f68c9ed0f3554532ace073412390396a.eu-west-1.aws.found.io:443#g' ./otel.yml && sed -i 's/\${env:ELASTIC_API_KEY}/Z19OQWJwRUJCUHN1ZHdqSE9rdUY6YXhsS1dxVEdUMi1MS1FVUW5Fb0VNZw==/g' ./otel.yml
  % Total	% Received % Xferd  Average Speed   Time	Time 	Time  Current
                             	Dload  Upload   Total   Spent	Left  Speed
100  286M  100  286M	0 	0  6606k  	0  0:00:44  0:00:44 --:--:-- 8547k
Warning: Got more output options than URLs
elastic-agent-8.15.0-linux-x86_64/data/elastic-agent-25075f/package.version
elastic-agent-8.15.0-linux-x86_64/elastic-agent.yml
elastic-agent-8.15.0-linux-x86_64/.build_hash.txt
elastic-agent-8.15.0-linux-x86_64/otelcol
elastic-agent-8.15.0-linux-x86_64/.elastic-agent.active.commit
elastic-agent-8.15.0-linux-x86_64/otel_samples/
elastic-agent-8.15.0-linux-x86_64/otel_samples/logs_metrics_traces.yml
elastic-agent-8.15.0-linux-x86_64/otel_samples/platformlogs.yml
elastic-agent-8.15.0-linux-x86_64/otel_samples/platformlogs_hostmetrics.yml
elastic-agent-8.15.0-linux-x86_64/LICENSE.txt
elastic-agent-8.15.0-linux-x86_64/data/elastic-agent-25075f/components/

(... many more files cut out from output ...)

elastic-agent-8.15.0-linux-x86_64/data/elastic-agent-25075f/components/pf-host-agent.spec.yml
elastic-agent-8.15.0-linux-x86_64/elastic-agent.reference.yml
elastic-agent-8.15.0-linux-x86_64/NOTICE.txt
elastic-agent-8.15.0-linux-x86_64/otel.yml
elastic-agent-8.15.0-linux-x86_64/data/elastic-agent-25075f/otelcol
elastic-agent-8.15.0-linux-x86_64/data/elastic-agent-25075f/elastic-agent
elastic-agent-8.15.0-linux-x86_64/manifest.yaml
elastic-agent-8.15.0-linux-x86_64/README.md
elastic-agent-8.15.0-linux-x86_64/elastic-agent
[sudo] password for andrzej:
$
Looks like the commands ran successfully on my machine. On Linux, I needed to provide my password for the sudo setcap command.
Let’s take a look at what has been installed.
$ pwd
/home/andrzej/elastic-distro-8.15.0-linux-x86_64
$ ls -la
total 2864
drwxrwxr-x  4 andrzej andrzej	4096 sie 20 07:28 .
drwxr-x--- 37 andrzej andrzej	4096 sie 20 07:37 ..
-rw-r--r--  1 andrzej andrzej  	41 sie  5 16:51 .build_hash.txt
drwxrwxr-x  4 andrzej andrzej	4096 sie 20 07:28 data
lrwxrwxrwx  1 andrzej andrzej  	39 sie  5 16:52 elastic-agent -> data/elastic-agent-25075f/elastic-agent
-rw-r--r--  1 andrzej andrzej  	41 sie  5 16:51 .elastic-agent.active.commit
-rw-r--r--  1 andrzej andrzej   14829 sie  5 16:50 elastic-agent.reference.yml
-rw-------  1 andrzej andrzej   12306 sie  5 16:50 elastic-agent.yml
-rw-r--r--  1 andrzej andrzej   13675 sie  5 16:49 LICENSE.txt
-rw-r--r--  1 andrzej andrzej 	339 sie  5 16:51 manifest.yaml
-rw-r--r--  1 andrzej andrzej 2839696 sie  5 16:49 NOTICE.txt
-rwxr-xr-x  1 andrzej andrzej  	85 sie  5 16:49 otelcol
drwxr-xr-x  2 andrzej andrzej	4096 sie  5 16:49 otel_samples
-rwxr-xr-x  1 andrzej andrzej	2998 sie 20 07:28 otel.yml
-rw-r--r--  1 andrzej andrzej 	351 sie  5 16:51 README.md
We are inside the elastic-distro-* directory that was created with the Elastic Agent files in it.
We are going to run the otelcol executable with the otel.yml configuration, so let’s take a look at these.
$ file otelcol
otelcol: Bourne-Again shell script, ASCII text executable
Oh, the otelcol file is just a shell script?
$ cat otelcol
#!/usr/bin/env bash

BASEDIR=$(dirname "$0")

exec "$BASEDIR/elastic-agent" otel "$@"
So running otelcol is the same as running elastic-agent otel. All right.
Let’s take a look at the configuration file created for us.
$ cat otel.yml
receivers:
  # Receiver for platform specific log files
  filelog/platformlogs:
    include: [ /var/log/*.log ]
    retry_on_failure:
      enabled: true
    start_at: end
    storage: file_storage
#   start_at: beginning

  # Receiver for CPU, Disk, Memory, and Filesystem metrics
  hostmetrics/system:
    collection_interval: 30s
    scrapers:
      disk:
      filesystem:
      cpu:
        metrics:
          system.cpu.utilization:
            enabled: true
          system.cpu.logical.count:
            enabled: true
      memory:
        metrics:
          system.memory.utilization:
            enabled: true
      process:
        mute_process_exe_error: true
        mute_process_io_error: true
        mute_process_user_error: true
        metrics:
          process.threads:
            enabled: true
          process.open_file_descriptors:
            enabled: true
          process.memory.utilization:
            enabled: true
          process.disk.operations:
            enabled: true
      network:
      processes:
      load:

extensions:
  file_storage:
    directory: /home/andrzej/elastic-distro-8.15.0-linux-x86_64/data/otelcol

processors:
  elasticinframetrics:
  resourcedetection:
    detectors: ["system"]
    system:
      hostname_sources: ["os"]
      resource_attributes:
        host.name:
          enabled: true
        host.id:
          enabled: false
        host.arch:
          enabled: true
        host.ip:
          enabled: true
        host.mac:
          enabled: true
        host.cpu.vendor.id:
          enabled: true
        host.cpu.family:
          enabled: true
        host.cpu.model.id:
          enabled: true
        host.cpu.model.name:
          enabled: true
        host.cpu.stepping:
          enabled: true
        host.cpu.cache.l2.size:
          enabled: true
        os.description:
          enabled: true
        os.type:
          enabled: true
  attributes/dataset:
    actions:
      - key: event.dataset
        from_attribute: data_stream.dataset
        action: upsert
  resource/process:
    attributes:
      - key: process.executable.name
        action: delete
      - key: process.executable.path
        action: delete

exporters:
  # Exporter to send logs and metrics to Elasticsearch
  elasticsearch:
    endpoints: ["https://REDACTED.eu-west-1.aws.found.io:443"]
    api_key: REDACTED
    mapping:
      mode: ecs
    logs_dynamic_index:
      enabled: true
    metrics_dynamic_index:
      enabled: true
    traces_dynamic_index:
      enabled: true

service:
  extensions: [file_storage]
  pipelines:
    metrics/hostmetrics:
      receivers: [hostmetrics/system]
      processors: [elasticinframetrics, resourcedetection, attributes/dataset, resource/process]
      exporters: [elasticsearch]
    logs/platformlogs:
      receivers: [filelog/platformlogs]
      processors: [resourcedetection]
      exporters: [elasticsearch]
This is a standard OpenTelemetry Collector configuration file as described in the OpenTelemetry documentation. The service::pipelines key defines the flow of the data from the receivers that collect the telemetry, through processors that modify it, to exporters that send the data away from the collector to external destinations. The service::extensions key specifies the extensions used. In this case the file_storage extension is responsible for providing persistent storage for use by other components, to prevent data loss during collector restarts. The detailed configuration for each component is specified in the exporters, extensions, processors and receivers sections. For example, the attributes/dataset processor is defined and configured under processors::attributes/dataset section, and used in the metrics/hostmetrics pipeline, as defined in the service::pipelines::metrics/hostmetrics::processors section.
In the otel.yml file, there are two pipelines defined under the service::pipelines key: logs/platformslogs for logs and metrics/hostmetrics for metrics. The logs pipeline uses the Filelog receiver (filelog/platformlogs) to collect content from all /var/log/*.log files on disk. The metrics pipeline uses the Host Metrics receiver (hostmetrics/system) to collect CPU, disk and other metrics about the host running the collector. Both pipelines use the Resource Detection processor (resourcedetection) to decorate the telemetry with some additional host information. The metrics pipeline also uses the Attributes processor (attributes/dataset) to add the event.dataset attribute on the metric data points and the Resource processor (resource/process) to delete some high cardinality resource attributes. The metrics pipeline also uses the Elastic Infra Metrics processor (elasticinframetrics), which is a component specific to the Elastic distribution of the OpenTelemetry Collector. The Elastic Infra Metrics processor is responsible for translating the metrics created by the Host Metrics receiver to the format understood by the integrations in Elastic that we will see in a moment. This translation is required, because the Elastic integrations cannot understand the native OpenTelemetry metrics yet.
The collected and processed logs and metrics are then being exported from the collector into Elastic Cloud using the Elasticsearch exporter. This exporter can also be used to send data to a locally installed Elasticsearch instance. The destination of the data is configured with the endpoints and api_key . Those have been conveniently already filled in with the credentials of our Elastic Cloud deployment by the commands we have executed. The other configuration options are mapping::mode: ecs that is also important for the Elastic integrations to understand the data correctly, and the logs_dynamic_index::enabled: true, metrics_dynamic_index::enabled: true and traces_dynamic_index::enabled: true. These options tell the Elasticsearch exporter to route the telemetry into the right Elasticsearch data streams, again for the integrations to be able to find the data.
All right, that was a lot of talking. Let’s run some commands again! Going back to the setup guide in Elastic Cloud, let’s now start the collector as described:
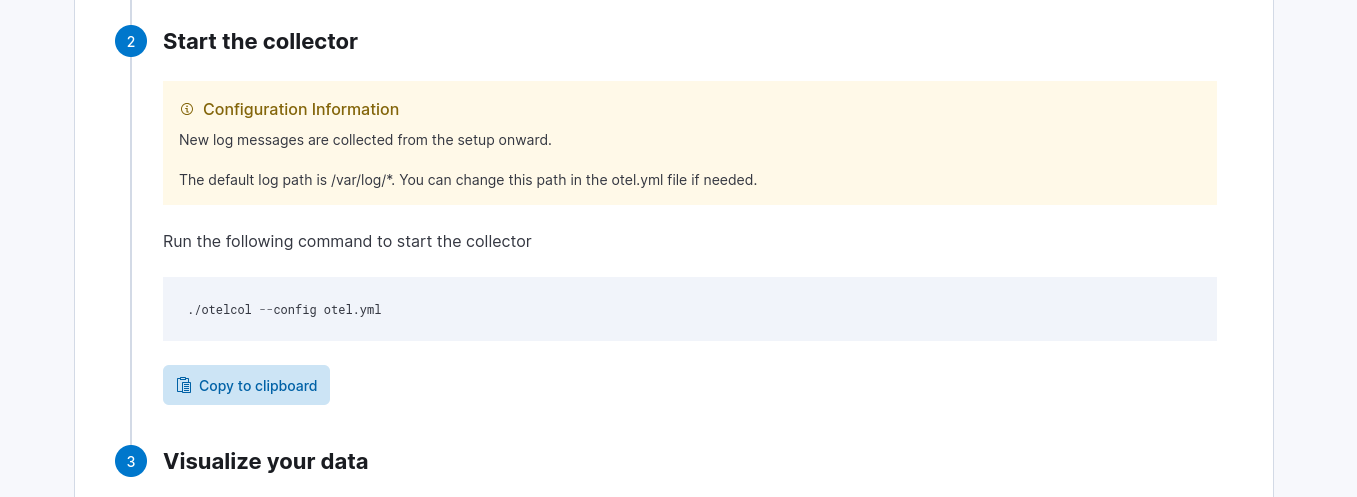
Here’s what it looked like when I ran it on my Linux machine:
$ ./otelcol --config otel.yml
Starting in otel mode
2024-08-20T09:24:06.345+0200	info	service@v0.105.0/service.go:116	Setting up own telemetry...
2024-08-20T09:24:06.346+0200	info	service@v0.105.0/service.go:119	OpenCensus bridge is disabled for Collector telemetry and will be removed in a future version, use --feature-gates=-service.disableOpenCensusBridge to re-enable
2024-08-20T09:24:06.346+0200	info	service@v0.105.0/telemetry.go:96	Serving metrics	{"address": ":8888", "metrics level": "Normal"}
2024-08-20T09:24:06.346+0200	info	exporter@v0.105.0/exporter.go:280	Development component. May change in the future.	{"kind": "exporter", "data_type": "metrics", "name": "elasticsearch"}
2024-08-20T09:24:06.348+0200	info	service@v0.105.0/service.go:198	Starting ./elastic-agent...	{"Version": "8.15.0", "NumCPU": 20}
2024-08-20T09:24:06.348+0200	info	extensions/extensions.go:34	Starting extensions...
2024-08-20T09:24:06.348+0200	info	extensions/extensions.go:37	Extension is starting...	{"kind": "extension", "name": "file_storage"}
2024-08-20T09:24:06.348+0200	info	extensions/extensions.go:52	Extension started.	{"kind": "extension", "name": "file_storage"}
2024-08-20T09:24:06.349+0200	info	internal/resourcedetection.go:125	began detecting resource information	{"kind": "processor", "name": "resourcedetection", "pipeline": "logs/platformlogs"}
2024-08-20T09:24:06.351+0200	info	internal/resourcedetection.go:139	detected resource information	{"kind": "processor", "name": "resourcedetection", "pipeline": "logs/platformlogs", "resource": {"host.arch":"amd64","host.cpu.cache.l2.size":24576,"host.cpu.family":"6","host.cpu.model.id":"186","host.cpu.model.name":"13th Gen Intel(R) Core(TM) i7-13700H","host.cpu.stepping":"2","host.cpu.vendor.id":"GenuineIntel","host.ip":["192.168.1.101","fe80::332a:19ed:432b:5f0f","172.17.0.1","172.19.0.1","172.18.0.1","fc00:f853:ccd:e793::1","192.168.49.1"],"host.mac":["00-E0-4C-A8-74-94","E4-C7-67-FF-8A-8E","02-42-DE-C3-2D-0D","02-42-DA-03-4C-8C","02-42-98-D3-7E-F0","02-42-15-F4-C8-CF"],"host.name":"astencel","os.description":"Ubuntu 24.04 LTS (Noble Numbat) (Linux astencel 6.8.0-40-generic #40-Ubuntu SMP PREEMPT_DYNAMIC Fri Jul  5 10:34:03 UTC 2024 x86_64)","os.type":"linux"}}
2024-08-20T09:24:06.351+0200	info	adapter/receiver.go:46	Starting stanza receiver	{"kind": "receiver", "name": "filelog/platformlogs", "data_type": "logs"}
2024-08-20T09:24:06.354+0200	info	service@v0.105.0/service.go:224	Everything is ready. Begin running and processing data.
2024-08-20T09:24:06.354+0200	info	localhostgate/featuregate.go:63	The default endpoints for all servers in components have changed to use localhost instead of 0.0.0.0. Disable the feature gate to temporarily revert to the previous default.	{"feature gate ID": "component.UseLocalHostAsDefaultHost"}
2024-08-20T09:24:06.554+0200	info	fileconsumer/file.go:256	Started watching file	{"kind": "receiver", "name": "filelog/platformlogs", "data_type": "logs", "component": "fileconsumer", "path": "/var/log/alternatives.log"}
2024-08-20T09:24:06.555+0200	info	fileconsumer/file.go:256	Started watching file	{"kind": "receiver", "name": "filelog/platformlogs", "data_type": "logs", "component": "fileconsumer", "path": "/var/log/apport.log"}
2024-08-20T09:24:06.555+0200	info	fileconsumer/file.go:256	Started watching file	{"kind": "receiver", "name": "filelog/platformlogs", "data_type": "logs", "component": "fileconsumer", "path": "/var/log/auth.log"}
2024-08-20T09:24:06.555+0200	info	fileconsumer/file.go:256	Started watching file	{"kind": "receiver", "name": "filelog/platformlogs", "data_type": "logs", "component": "fileconsumer", "path": "/var/log/boot.log"}
2024-08-20T09:24:06.555+0200	info	fileconsumer/file.go:256	Started watching file	{"kind": "receiver", "name": "filelog/platformlogs", "data_type": "logs", "component": "fileconsumer", "path": "/var/log/bootstrap.log"}
2024-08-20T09:24:06.555+0200	info	fileconsumer/file.go:256	Started watching file	{"kind": "receiver", "name": "filelog/platformlogs", "data_type": "logs", "component": "fileconsumer", "path": "/var/log/cloud-init-output.log"}
2024-08-20T09:24:06.555+0200	info	fileconsumer/file.go:256	Started watching file	{"kind": "receiver", "name": "filelog/platformlogs", "data_type": "logs", "component": "fileconsumer", "path": "/var/log/cloud-init.log"}
2024-08-20T09:24:06.555+0200	info	fileconsumer/file.go:256	Started watching file	{"kind": "receiver", "name": "filelog/platformlogs", "data_type": "logs", "component": "fileconsumer", "path": "/var/log/dpkg.log"}
2024-08-20T09:24:06.556+0200	info	fileconsumer/file.go:256	Started watching file	{"kind": "receiver", "name": "filelog/platformlogs", "data_type": "logs", "component": "fileconsumer", "path": "/var/log/fontconfig.log"}
2024-08-20T09:24:06.556+0200	info	fileconsumer/file.go:256	Started watching file	{"kind": "receiver", "name": "filelog/platformlogs", "data_type": "logs", "component": "fileconsumer", "path": "/var/log/gpu-manager-switch.log"}
If you have ever run the Elastic Agent, you can already see that the logs look nothing like those from the agent. On the other hand, if you’ve ever run the OpenTelemetry Collector, you can see the logs look just like those from the collector.
The Elastic Agent 8.15 source code includes the libraries from the OpenTelemetry Collector, so that when run in the otel mode, it executes those OpenTelemetry Collector libraries, essentially behaving like a regular OpenTelemetry Collector binary.
The logs from the agent do not tell us much about what’s going on. A much more interesting source of information is the collector’s metrics that are exposed at the HTTP endpoint http://localhost:8888/metrics. Let’s take a look at those. Either open another terminal window and run curl http://localhost:8888/metrics, or just open the URL in a web browser.
$ curl http://localhost:8888/metrics
# HELP otelcol_exporter_send_failed_log_records Number of log records in failed attempts to send to destination.
# TYPE otelcol_exporter_send_failed_log_records counter
otelcol_exporter_send_failed_log_records{exporter="elasticsearch",service_instance_id="edfa7aa4-565c-4b7c-81bf-60ea743f4a49",service_name="./elastic-agent",service_version="8.15.0"} 0
# HELP otelcol_exporter_send_failed_metric_points Number of metric points in failed attempts to send to destination.
# TYPE otelcol_exporter_send_failed_metric_points counter
otelcol_exporter_send_failed_metric_points{exporter="elasticsearch",service_instance_id="edfa7aa4-565c-4b7c-81bf-60ea743f4a49",service_name="./elastic-agent",service_version="8.15.0"} 0
# HELP otelcol_exporter_sent_log_records Number of log record successfully sent to destination.
# TYPE otelcol_exporter_sent_log_records counter
otelcol_exporter_sent_log_records{exporter="elasticsearch",service_instance_id="edfa7aa4-565c-4b7c-81bf-60ea743f4a49",service_name="./elastic-agent",service_version="8.15.0"} 14
# HELP otelcol_exporter_sent_metric_points Number of metric points successfully sent to destination.
# TYPE otelcol_exporter_sent_metric_points counter
otelcol_exporter_sent_metric_points{exporter="elasticsearch",service_instance_id="edfa7aa4-565c-4b7c-81bf-60ea743f4a49",service_name="./elastic-agent",service_version="8.15.0"} 178638
# HELP otelcol_fileconsumer_open_files Number of open files
# TYPE otelcol_fileconsumer_open_files gauge
otelcol_fileconsumer_open_files{service_instance_id="edfa7aa4-565c-4b7c-81bf-60ea743f4a49",service_name="./elastic-agent",service_version="8.15.0"} 14
# HELP otelcol_fileconsumer_reading_files Number of open files that are being read
# TYPE otelcol_fileconsumer_reading_files gauge
otelcol_fileconsumer_reading_files{service_instance_id="edfa7aa4-565c-4b7c-81bf-60ea743f4a49",service_name="./elastic-agent",service_version="8.15.0"} 0
# HELP otelcol_process_cpu_seconds Total CPU user and system time in seconds
# TYPE otelcol_process_cpu_seconds counter
otelcol_process_cpu_seconds{service_instance_id="edfa7aa4-565c-4b7c-81bf-60ea743f4a49",service_name="./elastic-agent",service_version="8.15.0"} 16.53
# HELP otelcol_process_memory_rss Total physical memory (resident set size)
# TYPE otelcol_process_memory_rss gauge
otelcol_process_memory_rss{service_instance_id="edfa7aa4-565c-4b7c-81bf-60ea743f4a49",service_name="./elastic-agent",service_version="8.15.0"} 1.80785152e+08
# HELP otelcol_process_runtime_heap_alloc_bytes Bytes of allocated heap objects (see 'go doc runtime.MemStats.HeapAlloc')
# TYPE otelcol_process_runtime_heap_alloc_bytes gauge
otelcol_process_runtime_heap_alloc_bytes{service_instance_id="edfa7aa4-565c-4b7c-81bf-60ea743f4a49",service_name="./elastic-agent",service_version="8.15.0"} 1.00911152e+08
# HELP otelcol_process_runtime_total_alloc_bytes Cumulative bytes allocated for heap objects (see 'go doc runtime.MemStats.TotalAlloc')
# TYPE otelcol_process_runtime_total_alloc_bytes counter
otelcol_process_runtime_total_alloc_bytes{service_instance_id="edfa7aa4-565c-4b7c-81bf-60ea743f4a49",service_name="./elastic-agent",service_version="8.15.0"} 2.490115624e+09
# HELP otelcol_process_runtime_total_sys_memory_bytes Total bytes of memory obtained from the OS (see 'go doc runtime.MemStats.Sys')
# TYPE otelcol_process_runtime_total_sys_memory_bytes gauge
otelcol_process_runtime_total_sys_memory_bytes{service_instance_id="edfa7aa4-565c-4b7c-81bf-60ea743f4a49",service_name="./elastic-agent",service_version="8.15.0"} 1.28278808e+08
# HELP otelcol_process_uptime Uptime of the process
# TYPE otelcol_process_uptime counter
otelcol_process_uptime{service_instance_id="edfa7aa4-565c-4b7c-81bf-60ea743f4a49",service_name="./elastic-agent",service_version="8.15.0"} 407.730436952
# HELP otelcol_receiver_accepted_log_records Number of log records successfully pushed into the pipeline.
# TYPE otelcol_receiver_accepted_log_records counter
otelcol_receiver_accepted_log_records{receiver="filelog/platformlogs",service_instance_id="edfa7aa4-565c-4b7c-81bf-60ea743f4a49",service_name="./elastic-agent",service_version="8.15.0",transport=""} 14
# HELP otelcol_receiver_accepted_metric_points Number of metric points successfully pushed into the pipeline.
# TYPE otelcol_receiver_accepted_metric_points counter
otelcol_receiver_accepted_metric_points{receiver="hostmetrics/system",service_instance_id="edfa7aa4-565c-4b7c-81bf-60ea743f4a49",service_name="./elastic-agent",service_version="8.15.0",transport=""} 69042
# HELP otelcol_receiver_refused_log_records Number of log records that could not be pushed into the pipeline.
# TYPE otelcol_receiver_refused_log_records counter
otelcol_receiver_refused_log_records{receiver="filelog/platformlogs",service_instance_id="edfa7aa4-565c-4b7c-81bf-60ea743f4a49",service_name="./elastic-agent",service_version="8.15.0",transport=""} 0
# HELP otelcol_receiver_refused_metric_points Number of metric points that could not be pushed into the pipeline.
# TYPE otelcol_receiver_refused_metric_points counter
otelcol_receiver_refused_metric_points{receiver="hostmetrics/system",service_instance_id="edfa7aa4-565c-4b7c-81bf-60ea743f4a49",service_name="./elastic-agent",service_version="8.15.0",transport=""} 0
# HELP otelcol_scraper_errored_metric_points Number of metric points that were unable to be scraped.
# TYPE otelcol_scraper_errored_metric_points counter
otelcol_scraper_errored_metric_points{receiver="hostmetrics/system",scraper="cpu",service_instance_id="edfa7aa4-565c-4b7c-81bf-60ea743f4a49",service_name="./elastic-agent",service_version="8.15.0"} 0
otelcol_scraper_errored_metric_points{receiver="hostmetrics/system",scraper="disk",service_instance_id="edfa7aa4-565c-4b7c-81bf-60ea743f4a49",service_name="./elastic-agent",service_version="8.15.0"} 0
otelcol_scraper_errored_metric_points{receiver="hostmetrics/system",scraper="filesystem",service_instance_id="edfa7aa4-565c-4b7c-81bf-60ea743f4a49",service_name="./elastic-agent",service_version="8.15.0"} 0
otelcol_scraper_errored_metric_points{receiver="hostmetrics/system",scraper="load",service_instance_id="edfa7aa4-565c-4b7c-81bf-60ea743f4a49",service_name="./elastic-agent",service_version="8.15.0"} 0
otelcol_scraper_errored_metric_points{receiver="hostmetrics/system",scraper="memory",service_instance_id="edfa7aa4-565c-4b7c-81bf-60ea743f4a49",service_name="./elastic-agent",service_version="8.15.0"} 0
otelcol_scraper_errored_metric_points{receiver="hostmetrics/system",scraper="network",service_instance_id="edfa7aa4-565c-4b7c-81bf-60ea743f4a49",service_name="./elastic-agent",service_version="8.15.0"} 0
otelcol_scraper_errored_metric_points{receiver="hostmetrics/system",scraper="process",service_instance_id="edfa7aa4-565c-4b7c-81bf-60ea743f4a49",service_name="./elastic-agent",service_version="8.15.0"} 0
otelcol_scraper_errored_metric_points{receiver="hostmetrics/system",scraper="processes",service_instance_id="edfa7aa4-565c-4b7c-81bf-60ea743f4a49",service_name="./elastic-agent",service_version="8.15.0"} 0
# HELP otelcol_scraper_scraped_metric_points Number of metric points successfully scraped.
# TYPE otelcol_scraper_scraped_metric_points counter
otelcol_scraper_scraped_metric_points{receiver="hostmetrics/system",scraper="cpu",service_instance_id="edfa7aa4-565c-4b7c-81bf-60ea743f4a49",service_name="./elastic-agent",service_version="8.15.0"} 41
otelcol_scraper_scraped_metric_points{receiver="hostmetrics/system",scraper="disk",service_instance_id="edfa7aa4-565c-4b7c-81bf-60ea743f4a49",service_name="./elastic-agent",service_version="8.15.0"} 98
otelcol_scraper_scraped_metric_points{receiver="hostmetrics/system",scraper="filesystem",service_instance_id="edfa7aa4-565c-4b7c-81bf-60ea743f4a49",service_name="./elastic-agent",service_version="8.15.0"} 28
otelcol_scraper_scraped_metric_points{receiver="hostmetrics/system",scraper="load",service_instance_id="edfa7aa4-565c-4b7c-81bf-60ea743f4a49",service_name="./elastic-agent",service_version="8.15.0"} 42
otelcol_scraper_scraped_metric_points{receiver="hostmetrics/system",scraper="memory",service_instance_id="edfa7aa4-565c-4b7c-81bf-60ea743f4a49",service_name="./elastic-agent",service_version="8.15.0"} 28
otelcol_scraper_scraped_metric_points{receiver="hostmetrics/system",scraper="network",service_instance_id="edfa7aa4-565c-4b7c-81bf-60ea743f4a49",service_name="./elastic-agent",service_version="8.15.0"} 70
otelcol_scraper_scraped_metric_points{receiver="hostmetrics/system",scraper="process",service_instance_id="edfa7aa4-565c-4b7c-81bf-60ea743f4a49",service_name="./elastic-agent",service_version="8.15.0"} 41318
otelcol_scraper_scraped_metric_points{receiver="hostmetrics/system",scraper="processes",service_instance_id="edfa7aa4-565c-4b7c-81bf-60ea743f4a49",service_name="./elastic-agent",service_version="8.15.0"} 28
# HELP target_info Target metadata
# TYPE target_info gauge
target_info{service_instance_id="edfa7aa4-565c-4b7c-81bf-60ea743f4a49",service_name="./elastic-agent",service_version="8.15.0"} 1
There’s a lot of information here, some of it more interesting, some of it not so much.
First, let’s look at the bottom:
target_info{service_instance_id="edfa7aa4-565c-4b7c-81bf-60ea743f4a49",service_name="./elastic-agent",service_version="8.15.0"} 1
The target_info metric tells us a little bit about the process that is exposing the metrics. We can see the service name is ./elastic-agent and the version is 8.15.0. The service instance ID is a unique ID associated with the process.
To see if any logs have been collected, let’s look at the following metrics:
otelcol_receiver_accepted_log_records{receiver="filelog/platformlogs",service_instance_id="edfa7aa4-565c-4b7c-81bf-60ea743f4a49",service_name="./elastic-agent",service_version="8.15.0",transport=""} 14
otelcol_receiver_refused_log_records{receiver="filelog/platformlogs",service_instance_id="edfa7aa4-565c-4b7c-81bf-60ea743f4a49",service_name="./elastic-agent",service_version="8.15.0",transport=""} 0
The otelcol_receiver_accepted_log_records metric tells us that 14 log records have been collected by the filelog/platformlogs receiver. The otelcol_receiver_refused_log_records is 0, which is good - this means there are no logs that were not accepted by the receiver.
Let’s see if any metrics have been collected:
otelcol_receiver_accepted_metric_points{receiver="hostmetrics/system",service_instance_id="edfa7aa4-565c-4b7c-81bf-60ea743f4a49",service_name="./elastic-agent",service_version="8.15.0",transport=""} 69042
otelcol_receiver_refused_metric_points{receiver="hostmetrics/system",service_instance_id="edfa7aa4-565c-4b7c-81bf-60ea743f4a49",service_name="./elastic-agent",service_version="8.15.0",transport=""} 0
The otelcol_receiver_accepted_metric_points metric tells us that 69042 data points have been collected by the hostmetrics/system receiver. That’s quite a bit! The configuration for the Host Metrics receiver collects quite a lot of metrics. If you want to cut down on the metrics ingestion, you might want to modify the receiver’s configuration, for example by disabling some of the metrics or removing some of the scrapers altogether.
Again, the otelcol_receiver_refused_metric_points tells us that 0 data points have been refused, which is a sign that everything works well.
These metrics tell us that the collector was able to collect the data, but did it export it? Let’s look at the export metrics:
otelcol_exporter_send_failed_log_records{exporter="elasticsearch",service_instance_id="edfa7aa4-565c-4b7c-81bf-60ea743f4a49",service_name="./elastic-agent",service_version="8.15.0"} 0
otelcol_exporter_send_failed_metric_points{exporter="elasticsearch",service_instance_id="edfa7aa4-565c-4b7c-81bf-60ea743f4a49",service_name="./elastic-agent",service_version="8.15.0"} 0
otelcol_exporter_sent_log_records{exporter="elasticsearch",service_instance_id="edfa7aa4-565c-4b7c-81bf-60ea743f4a49",service_name="./elastic-agent",service_version="8.15.0"} 14
otelcol_exporter_sent_metric_points{exporter="elasticsearch",service_instance_id="edfa7aa4-565c-4b7c-81bf-60ea743f4a49",service_name="./elastic-agent",service_version="8.15.0"} 178638
Similarly to the receiver metrics, we have a pair of metrics for each signal (logs, metrics) - one metric for successfully sent telemetry, one for failures.
The otelcol_exporter_sent_log_records metrics tells us that 14 logs have been successfully exported by the elasticsearch exporter. That’s great news! That’s exactly the 14 logs that have been collected by the logs/platformlogs receiver.
The otelcol_exporter_send_failed_log_records metric tells us there were 0 failures exporting logs. Good!
For metrics, the otelcol_exporter_sent_metric_points tells us that the elasticsearch exporter has exported 178638 data points. Wait, that’s a lot more (twice as much!) than what the hostmetrics/system receiver collected (69042)! What’s going on here? The additional metrics were added by the Elastic Infra Metrics processor, which creates new metrics that match the Elastic integrations, but leaves the original metrics in place.
Going back to the exporter metrics, all telemetry has apparently been successfully exported by the Elasticsearch exporter. Let’s now go back to the Elastic Cloud to see it.

After clicking on the “Open Logs Explorer” you should be redirected to an “Observability - Logs - Logs Explorer” view and you should see the logs collected from the /var/log/*.log files.
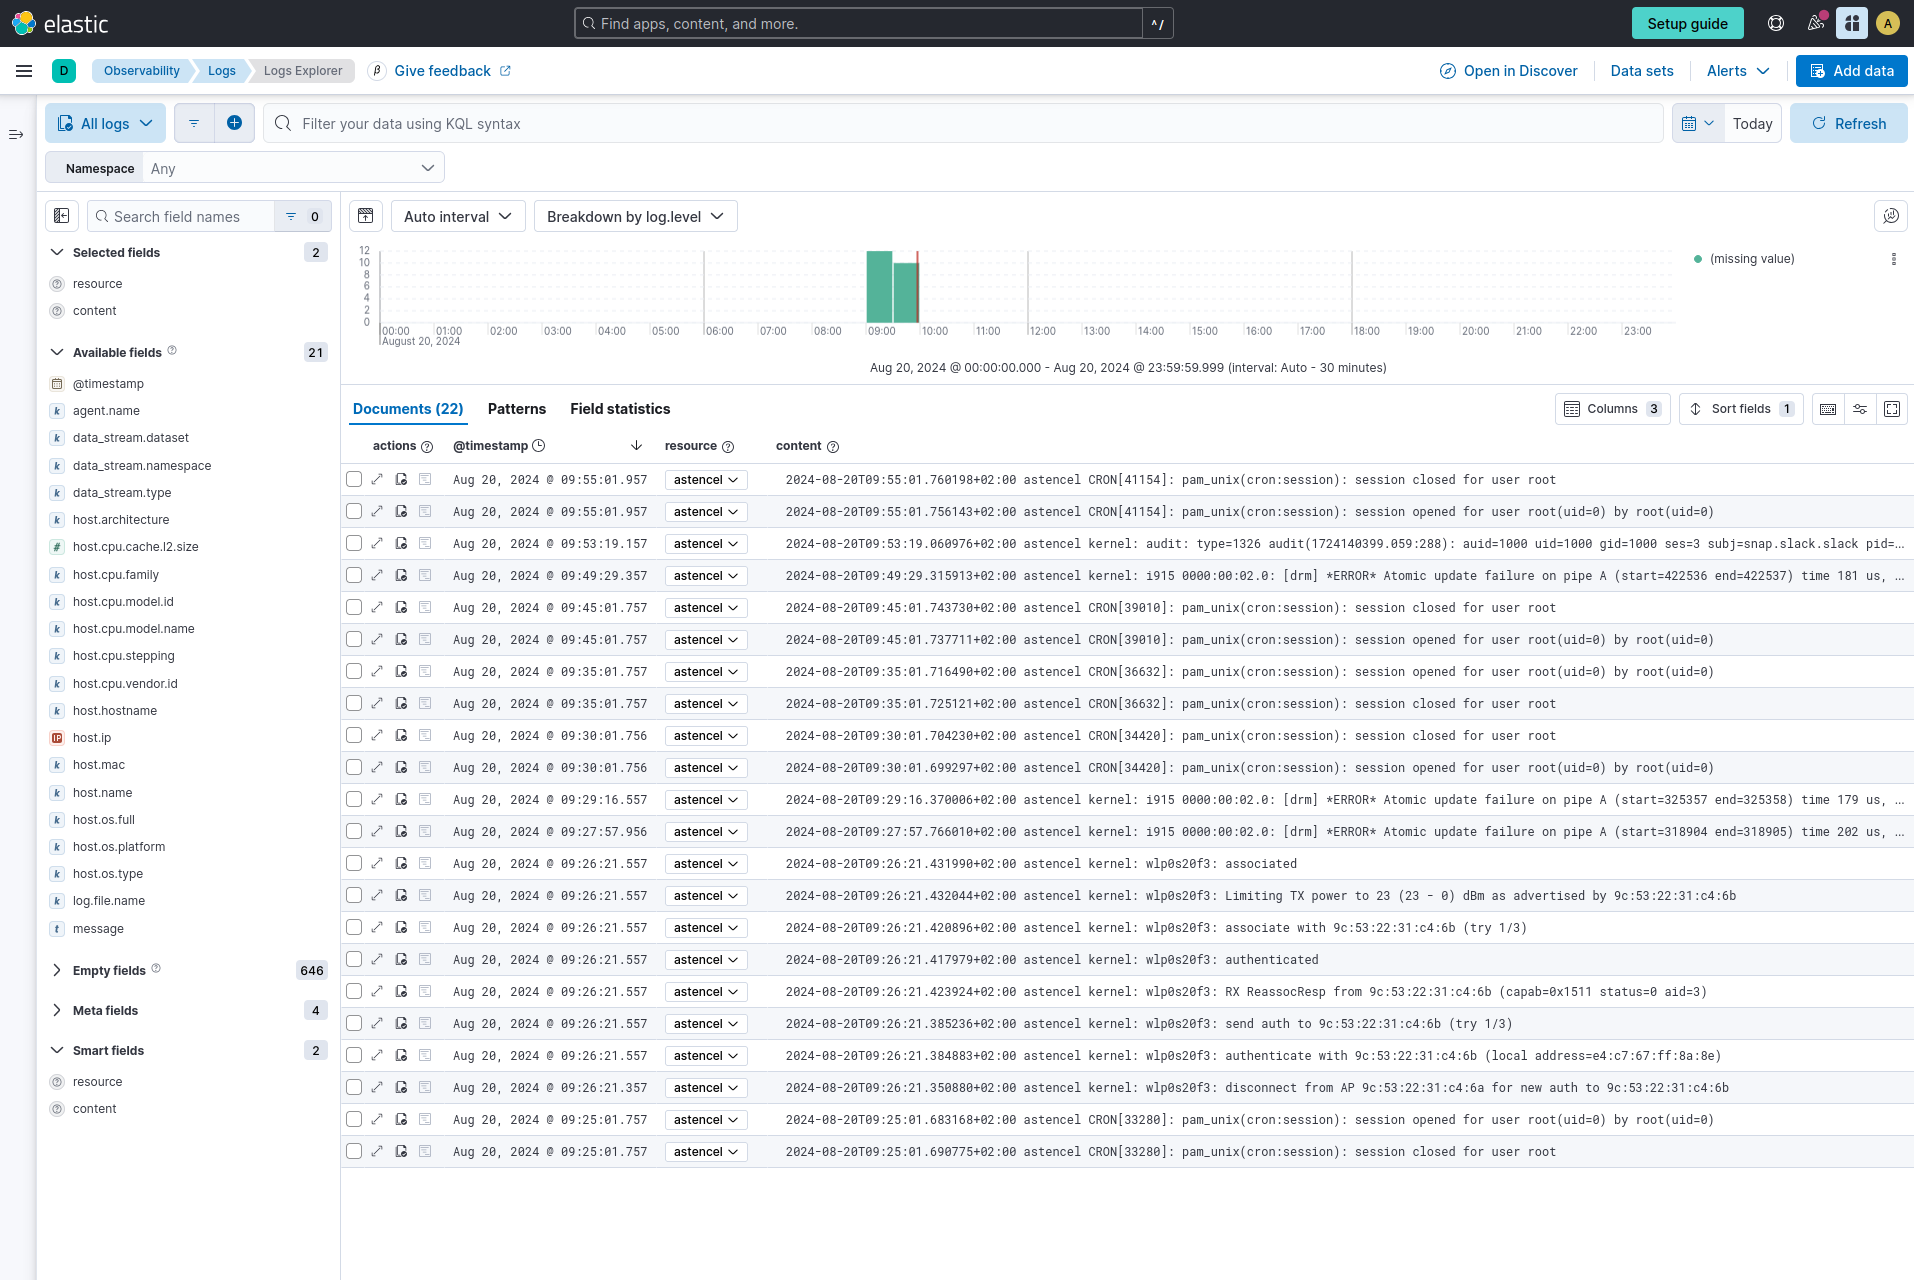
You can add some more fields from the left to the view, like log.file.name or some host attributes like host.os.* Or host.architecture.
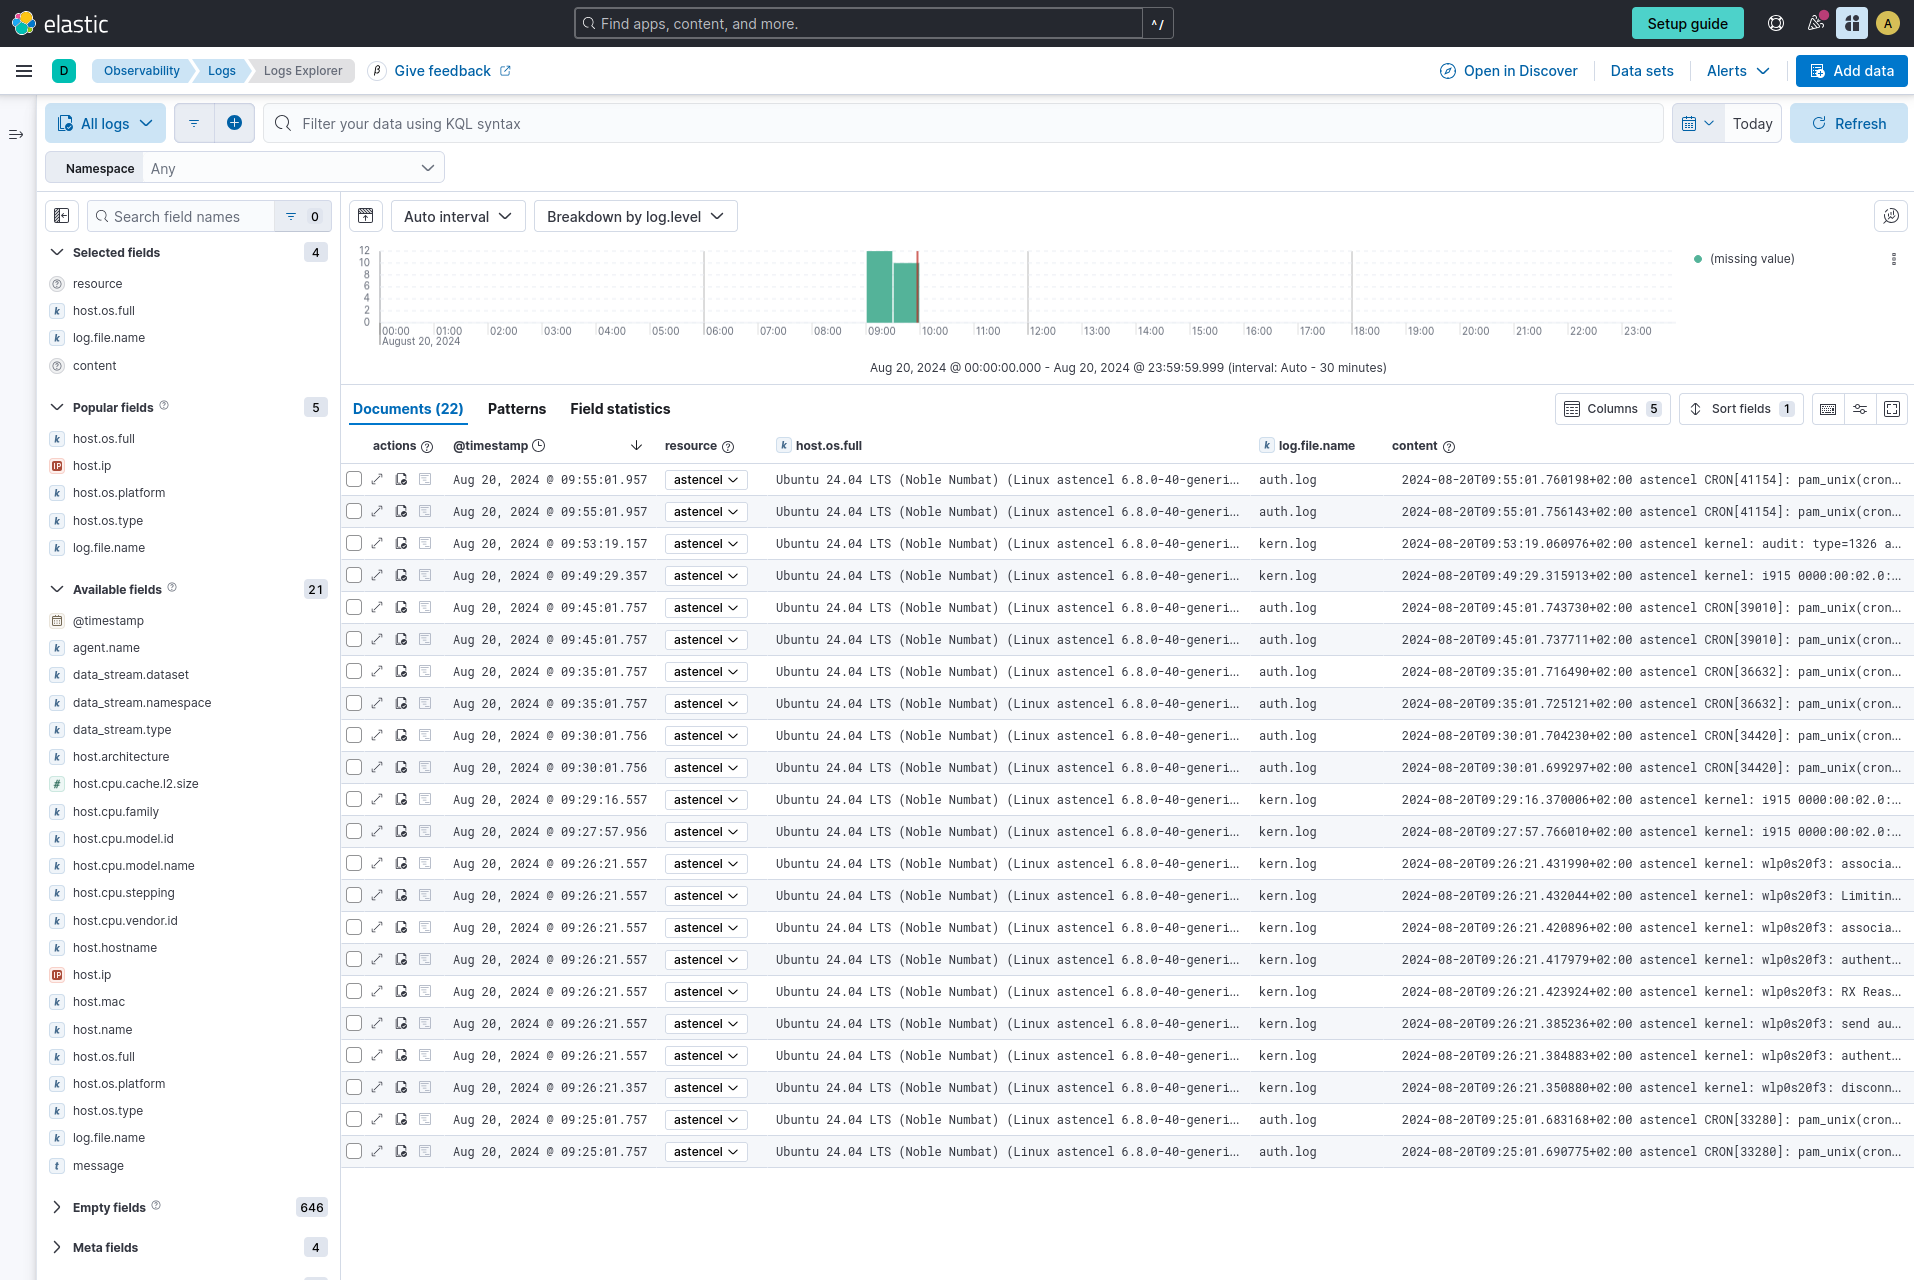
This is some useful information! If you want to collect data from other files, modify the receivers::filelog/platformlogs::include configuration in otel.yml file. See the receiver’s documentation for more information.
Now let’s click on the “Open Hosts” link in the setup guide. You should be redirected to the “Observability - Infrastructure - Hosts” view.
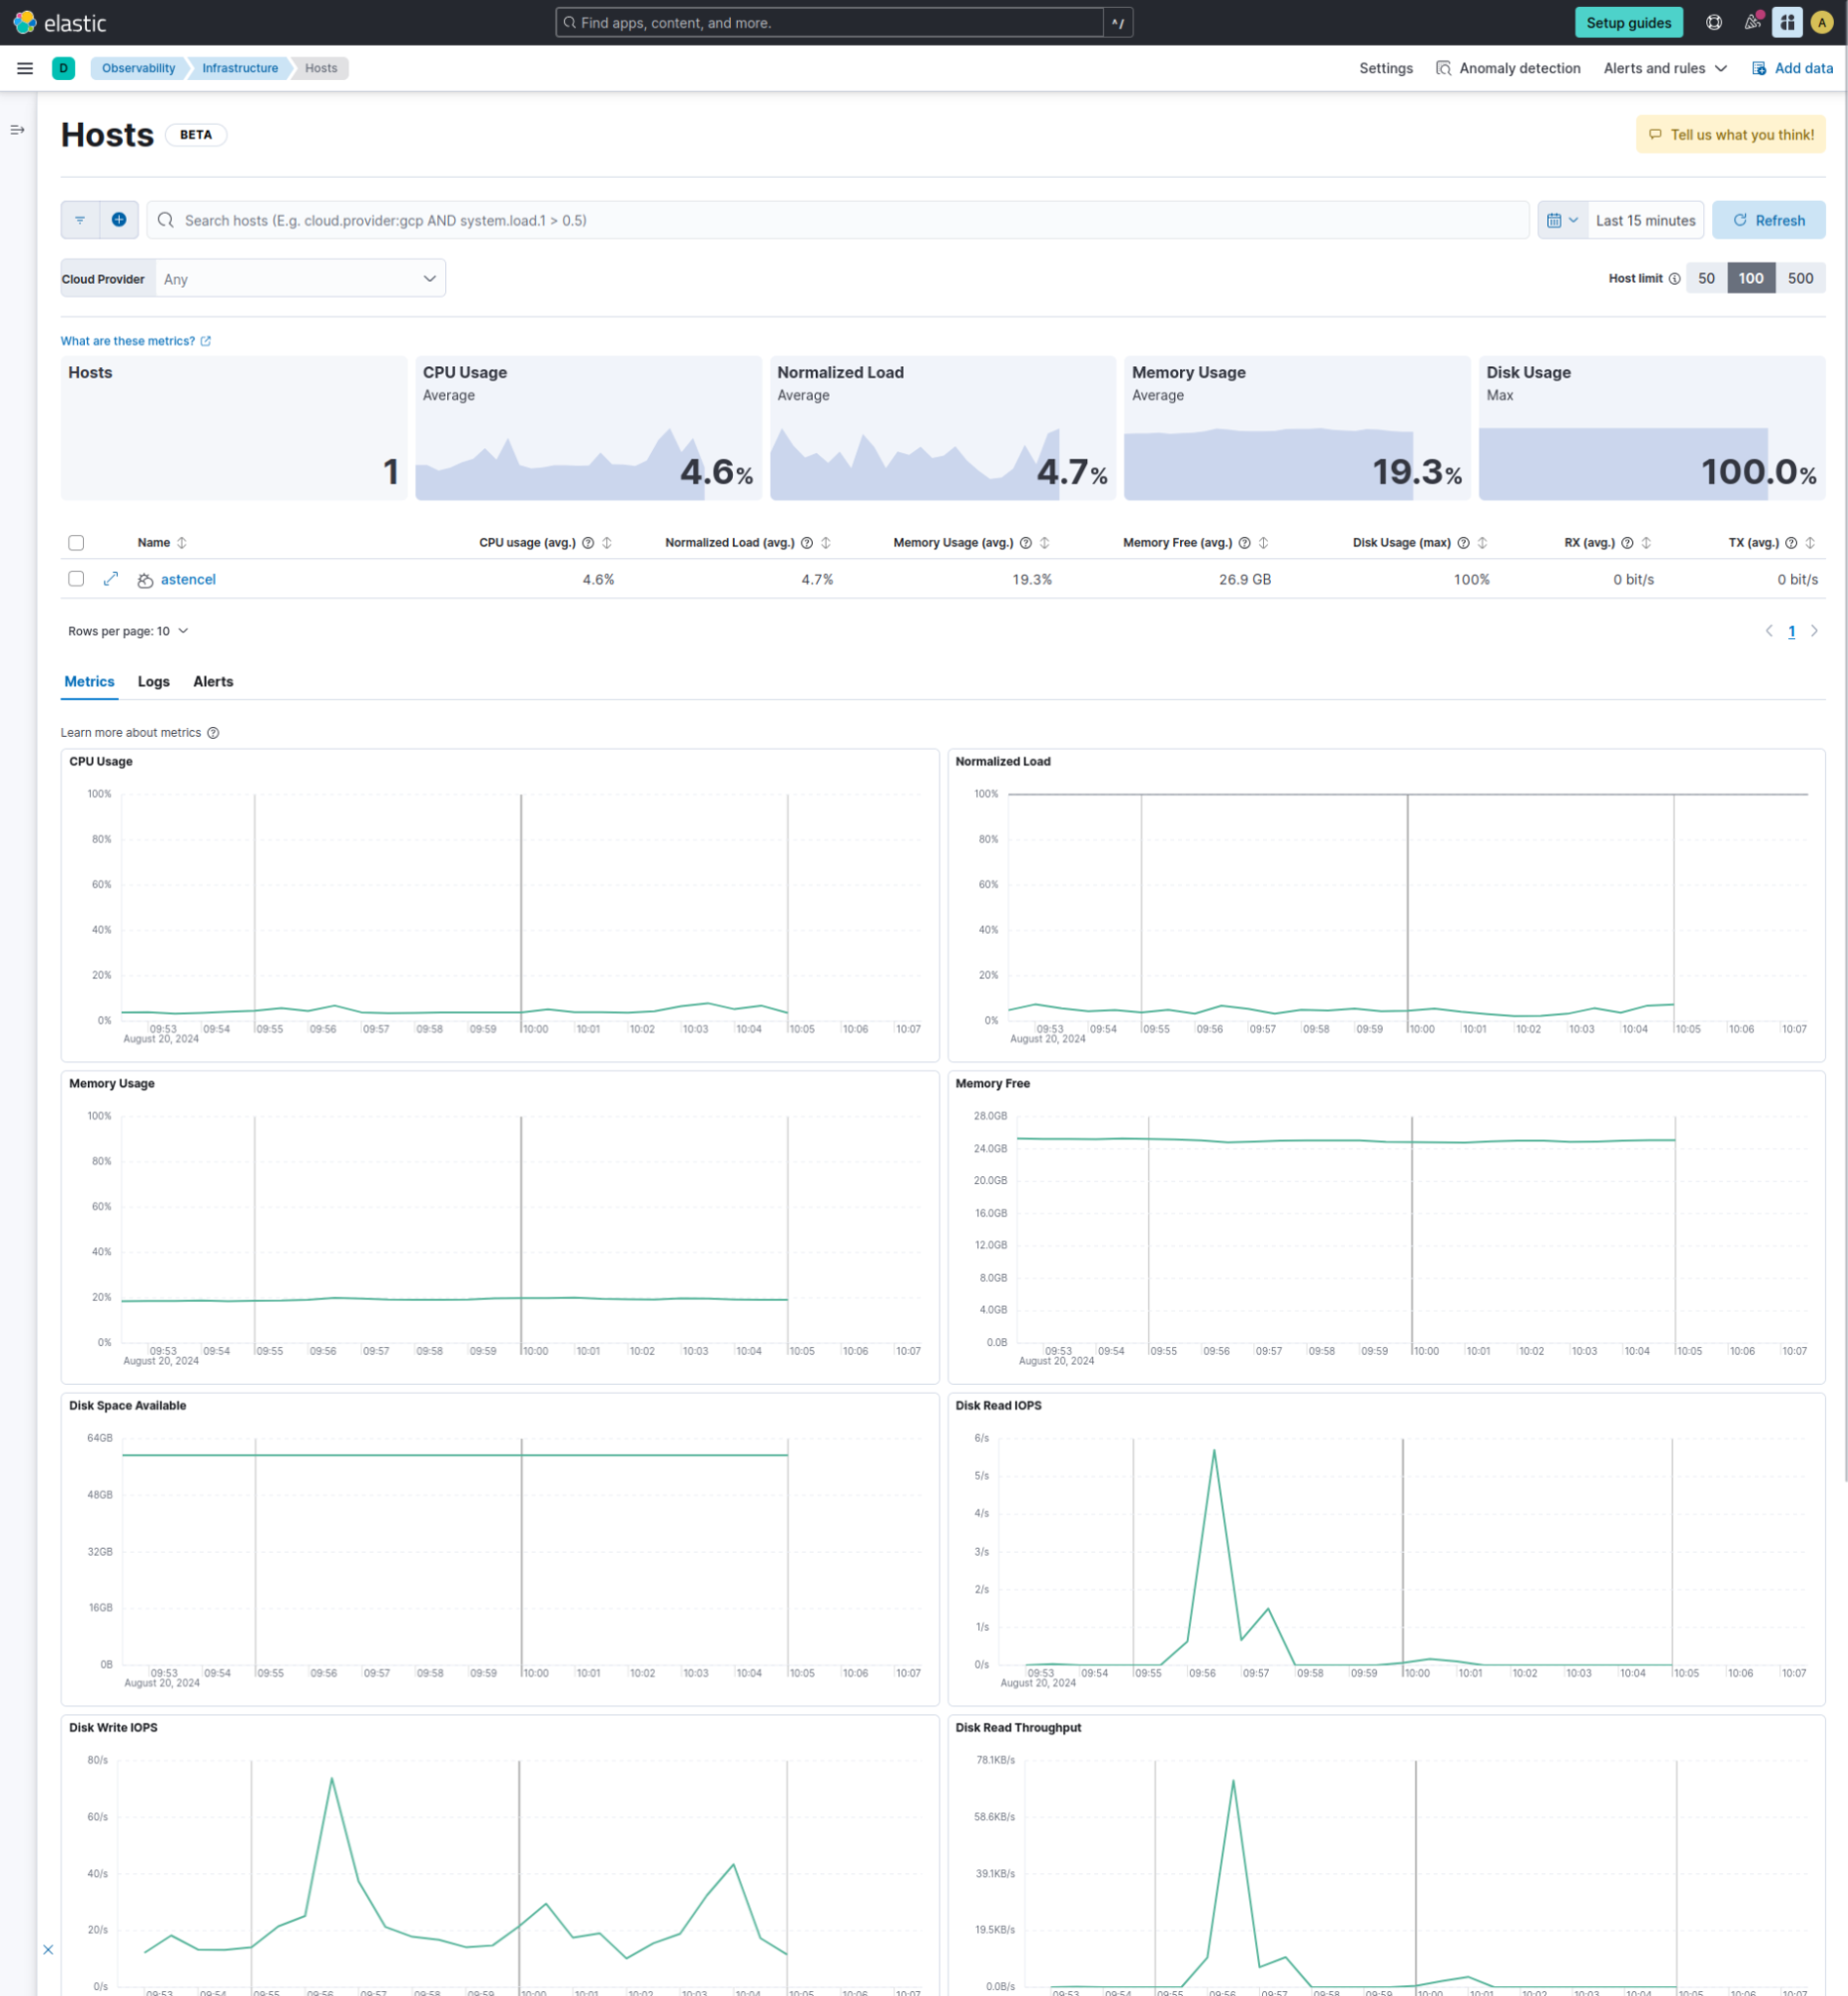
Looking good! We have successfully run the Elastic distribution of the OpenTelemetry Collector and collected some host logs and metrics, and even got the built-in Elastic infrastructure UIs to show some meaningful data about our host. Congrats!